Uncategorized
Government Wage Gap Data
Seventeen percent of United States citizens work for the government.
Published November 02, 2018 | 15 min read
Seventeen percent of United States citizens work for the government. But since employees work for thousands of different agencies between local, state, and federal, the information on Uncle Sam’s payroll is fragmented. It’s kept on different computers, in filing cabinets, and around offices across the country.
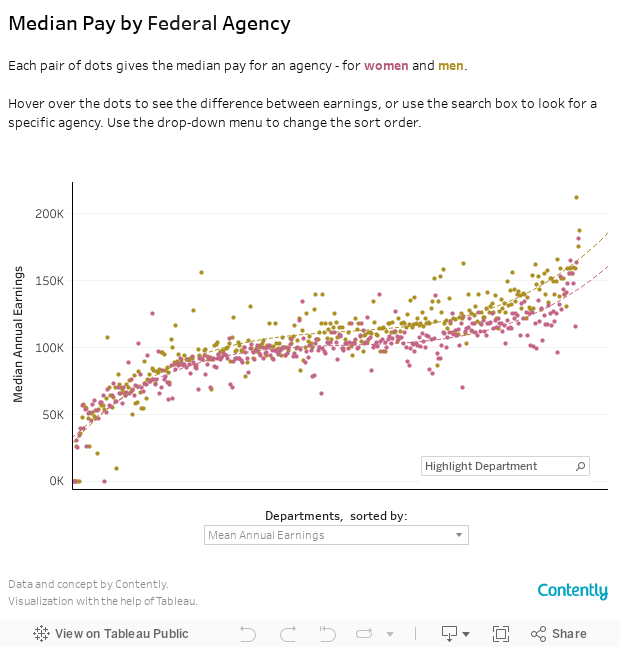
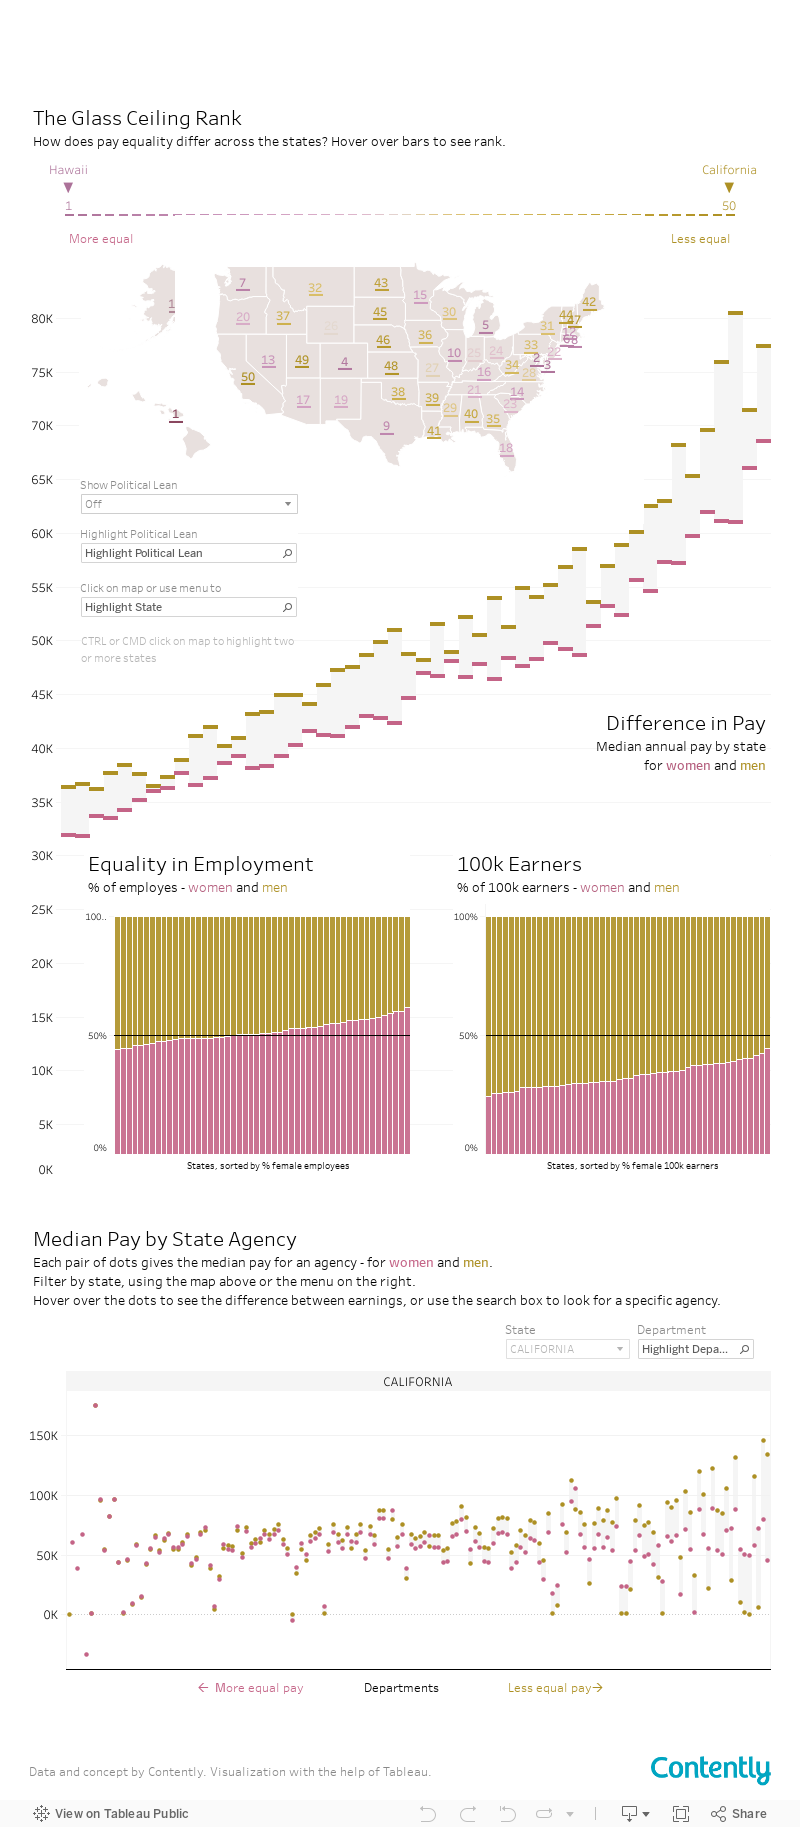
We spent twelve months petitioning agencies for their payroll data, so we could put it all in one place and look at trends—from job types to pay to how race, age, and gender are represented. We’ll be sharing the data sets over the next few weeks. Meanwhile, here are some highlights of our first analysis of the data: Here’s how we did it:
The Freedom of Information Act requires the government to be transparent with information that is pertinent to the public. This includes how much money the government pays its employees. Some cities and states actually post their payroll data online, but most require an official FOI request to disclose it.
We used a nonprofit service called Muckrock, which provides an online application for submitting and tracking FOI requests, to manage the project. Starting in July 2015, we sent requests to all 50 states, the 50 largest cities, and all of the federal agencies, requesting payroll figures by employee name, job title, department, location, age, gender, and ethnicity for the most recent year.
About one-third of agencies fully complied with the request. About fifty percent responded with payroll data that did not include age, gender, and ethnicity, citing privacy concerns. (The Freedom of Information Act includes a provision that allows agencies to deny requests that they deem “unwarranted” and harmful invasions of individual privacy.) Many of these agencies, once they learned of our goal, were willing to send all of the data after all. The rest, with a few exceptions, agreed to either send payroll data without names or without genders. For those agencies that just sent names without gender, we were able to use an algorithm based on U.S. Census data to extract the gender. (See below.)
One agency simply would not cooperate: The Department of Defense. In order to comply with the law that requires them to give this information when requested through FOI, they sent us this document along with a list of codes from which we might construct a list of job titles and numbers associated with them. The file not only did not include the gender data we asked for, but was also so redacted as to nullify its usefulness. When we spoke with the department about this, their spokesperson initially claimed that they had sent usable information, and then claimed later that they were exempt from having to send it. Our understanding of the Freedom of Information Act is that the DoD is not above the law, though the department’s response left us with no recourse but to exclude the department from our study.
Two states did not respond to our FOI requests at all: Arkansas and Kansas. Additionally, we sent the State of Utah 33 follow up requests over the course of a year after the state acknowledged receipt of the request but then did not ever comply with the request. Fortunately, we were able to find payroll data on each of these states’ transparency websites. Several cities did not respond or send usable data as well. In some cases, the data sent was unusable because it was blurrily scanned from paper, but we were able to download it from the transparency website as well. In the end, we were able to compile data from all 50 states. We excluded the city data (of which we compiled 35 of the top 50 cities) from our analysis for our first report.
The data is the most recent each agency had on hand. Most agencies sent us 2015 payroll data, though a few sent 2014 data.
Government agencies each use their own information systems to track their employees, so the data we received came in many forms. Some agencies gave us spreadsheets with full names in one column, others gave us PDFs with a first name in one column, and a last name in another column. Some agencies gave us total compensation data, while others split wages and overtime and other pay into separate columns. We took all of these data sets and file types and married them into a single database in which we added up total compensation for each employee.
Agencies gave us both full-time and part-time employee earnings data. Since different agencies pay each type of employee on different pay cycles, we had to in some cases calculate the total annual pay based on individual agencies’ policies. In some cases, where the agencies did not respond to requests for clarification, we had to infer the pay periods based on information found in the agencies’ hiring materials and double check them against individuals’ salaries on transparency websites. In order to properly compare part-time wages (since many agencies did not give us the number of hours worked, just the rate), we annualized all part-time wages, meaning that our data set shows what part-time workers would make if they were working full time.
Because we had to marry the data this way, we could primarily measure the percentage differences within agencies, and then compare those differences across agencies.
For the agencies that did not provide gender data, we used an algorithm called Gender-Api, which takes data from U.S. Census records to calculate the likely gender of a person’s first name. We used this for about one-third of our data. The algorithm calculated the gender of most names at between 97 percent and 99 percent accuracy. Ambiguous gender names (below 70 percent accuracy) made up a fraction of one percent of the data set and were either manually checked or discarded.
For analysis, we utilized Tableau, a business intelligence software tool that allows for complex calculations and visualizations of data. Tableau’s data team assisted us with the analysis to verify the accuracy of our calculations and conclusions, and also to make our interactive charts pretty.